


CARDTAPP ANALYTICS
Transform Your Data with Our Business Analytics Platforms
Most business analytics platforms promise visibility but bury it behind a data team, custom configuration, and weeks of setup. Cardtapp Analytics is different. It pulls directly from your Cardtapp activity data, organizes it into pre-built dashboards, and surfaces the metrics your team actually needs — the moment you log in, not weeks later.
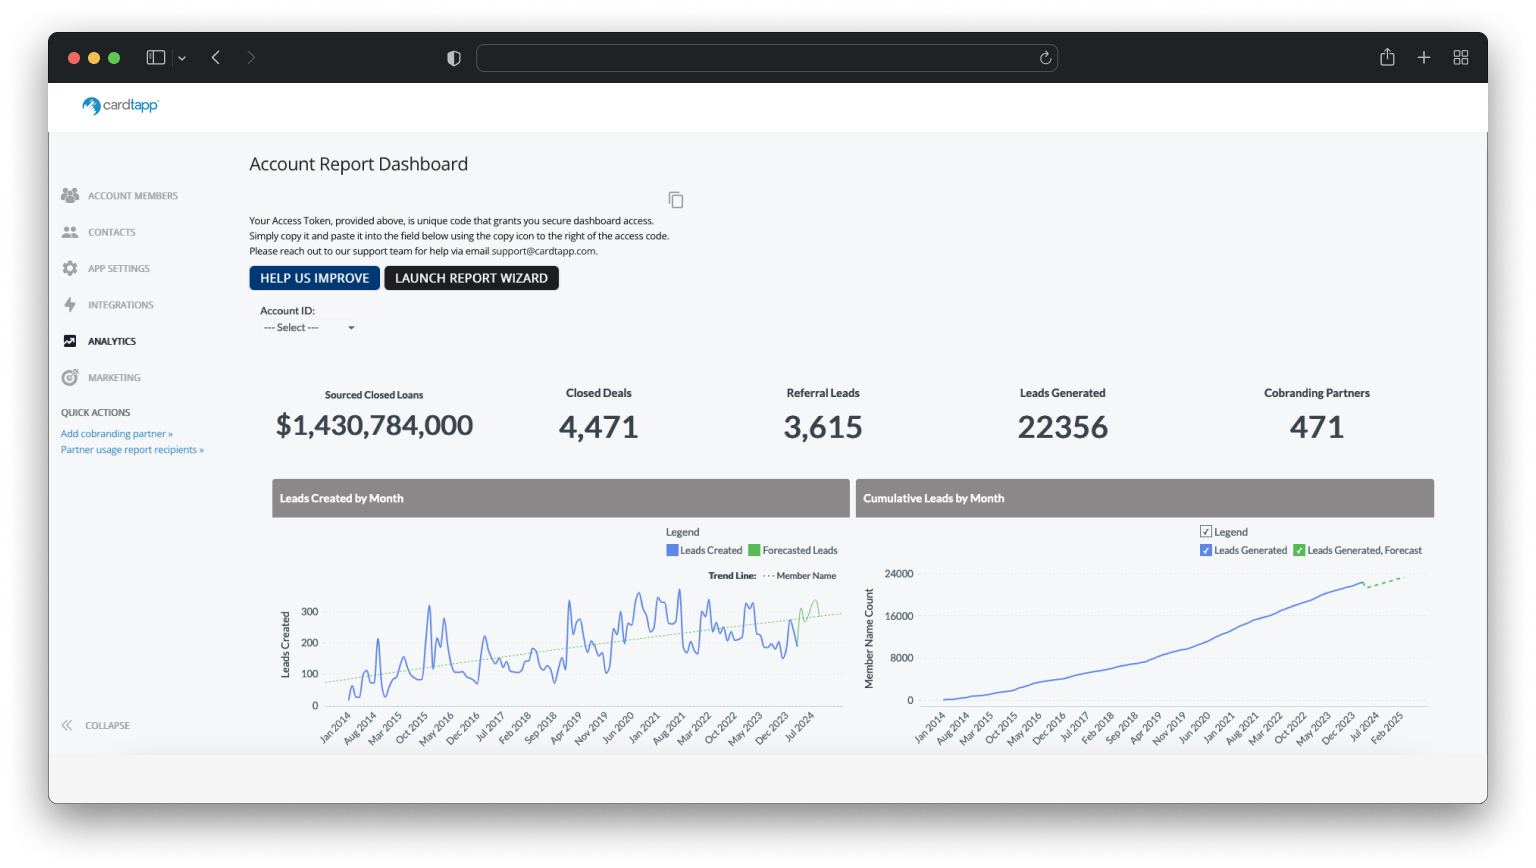
Data Analysis
Transform Your Data into Insights and Actions Rapidly
Pre-built dashboards do the heavy lifting so you don’t have to. Monitor essential business metrics, observe long-term trends, spot anomalies, and forecast future developments — all without building a single report from scratch. Whether you’re a manager reviewing team performance or a rep tracking your own referral activity, the data is ready when you are.
Visualize Data
Visualize Your Team's Data
Take advantage of an extensive library of charts, widgets, pivot tables, and tabular views for a comprehensive data visualization experience. Your team’s activity does not have to live in a spreadsheet.
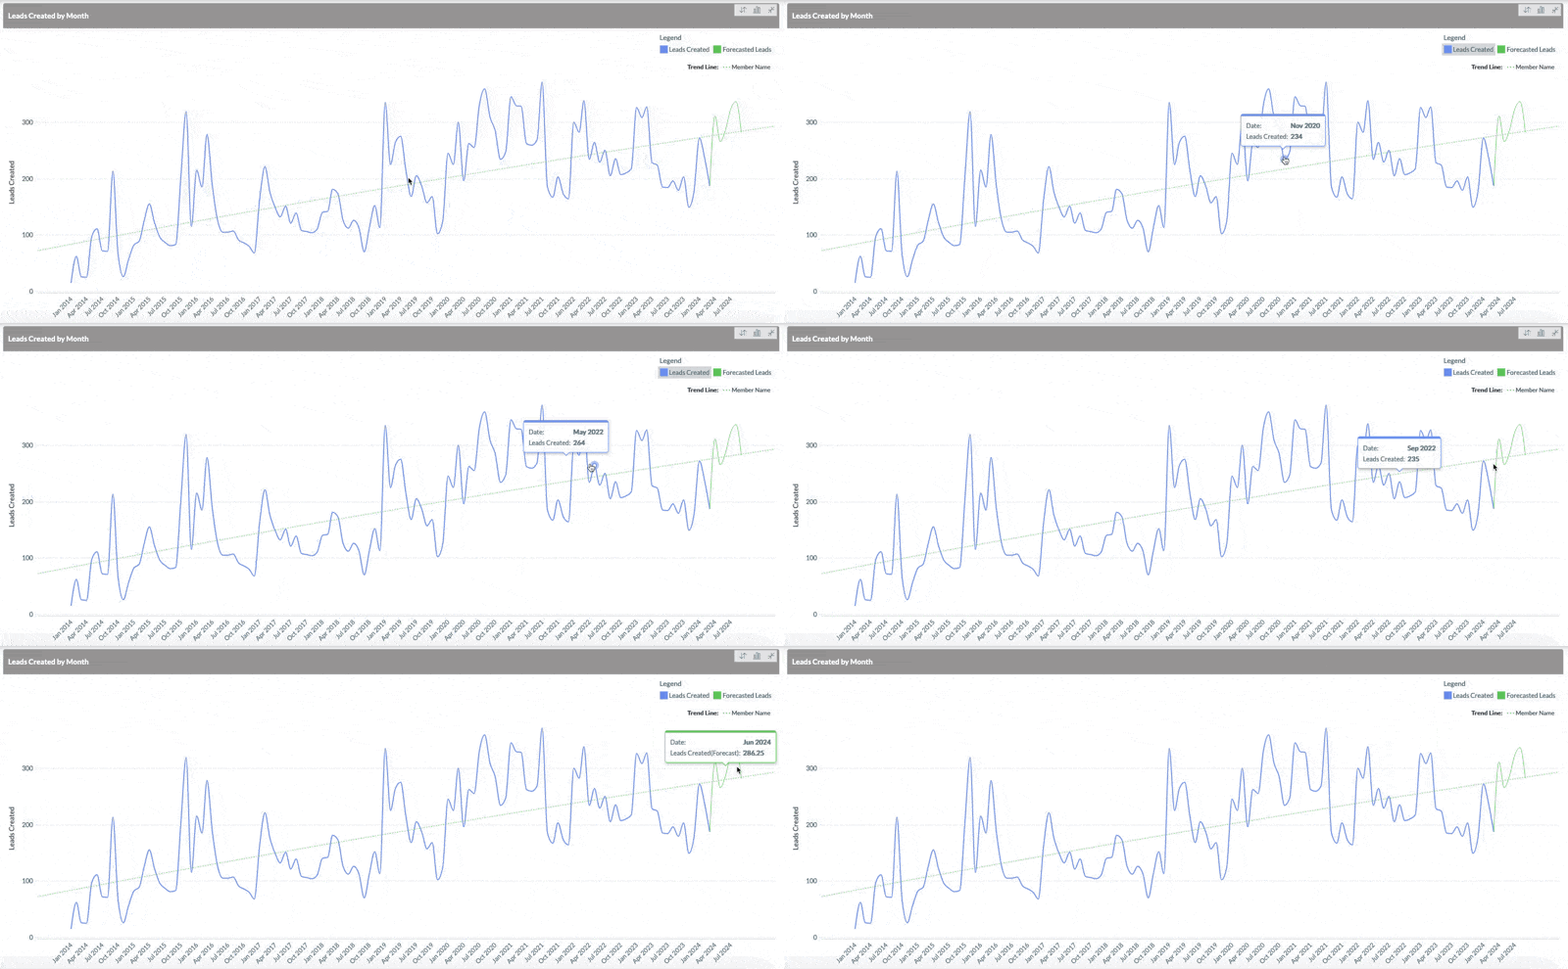

Trend & Forecast Data
Monitor Trends in Real Time
Experience immediate trend analysis with dynamic visualizations that update as your team engages with clients. Stay ahead with real-time insights into your team’s performance across key components.
- Track the number of successful conversions
- Gauge the effectiveness of your team's sales and marketing efforts
- Uncover the impact of referrals in your business
Automation
Set Up Automated Emails
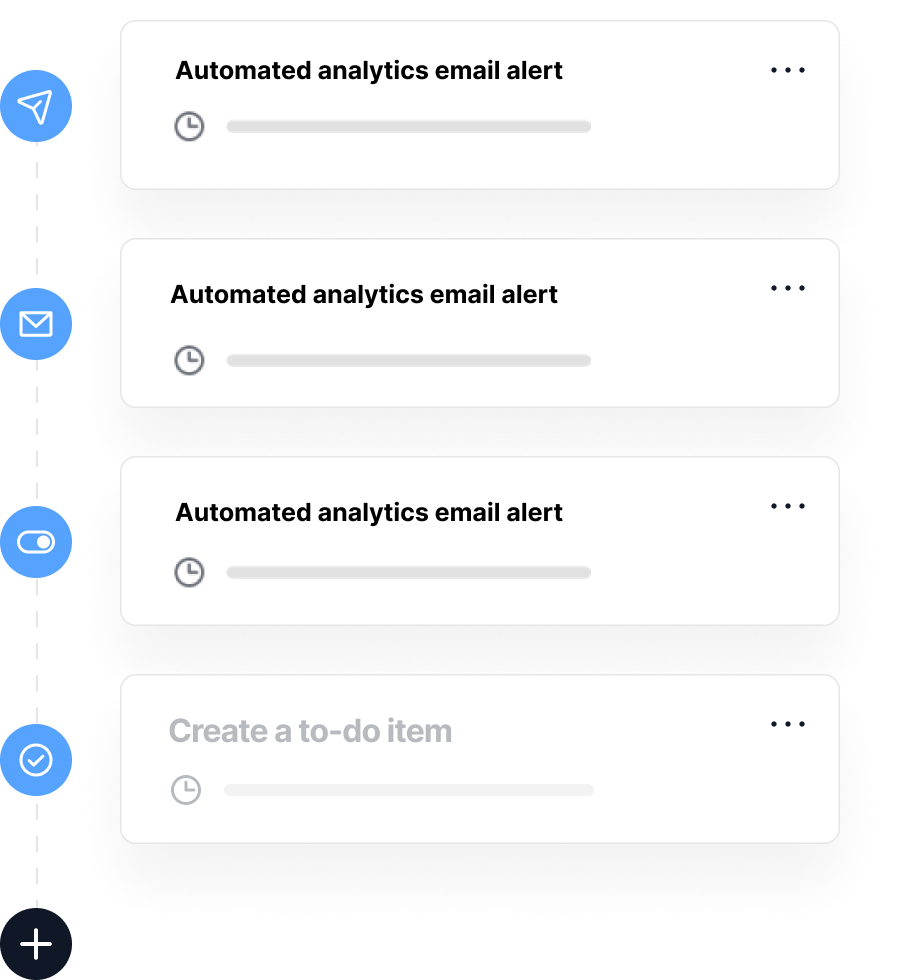
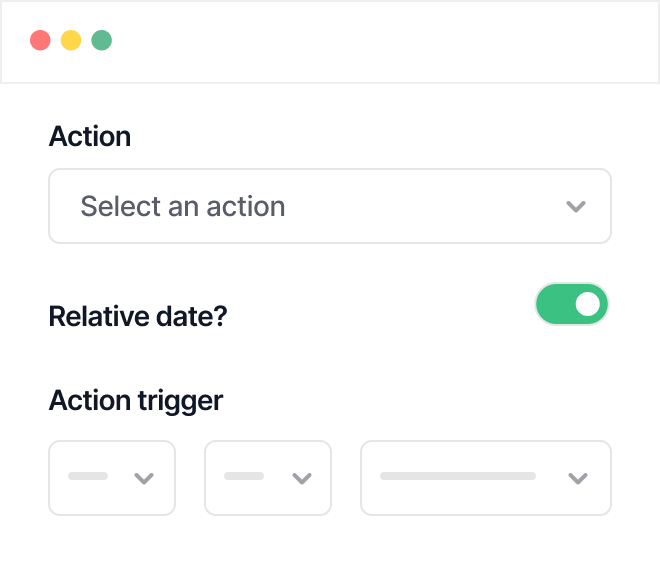
Keep your finger on the pulse of your business with the automated email and alert system. Customizable and convenient, this feature ensures you’re always informed about the key insights and analytics from your dashboards, without having to check in manually.
Key Features
Unlike most BI analytics software, here is what Cardtapp gives you right out of the box.
Pre-Built Dashboards
Cardtapp Analytics comes with dashboards that are already built and ready to go the moment you log in. There is no blank canvas to configure and no SQL queries to write. The metrics are pre-organized around what client-facing sales teams need to measure.
Data Visualization Library
From bar charts and line graphs to pivot tables and tabular data views, the platform gives you multiple ways to look at the same data. You can choose the view that makes the most sense for what you’re trying to communicate, whether you’re preparing for a team meeting or reviewing a full month of referral activity.
Trend and Forecast Analysis
The platform goes beyond showing you what happened last week. Cardtapp Analytics surfaces directional trends in your data so you can see where performance is heading, not just where it has been. This is especially useful for spotting dips in engagement before they turn into revenue gaps.
Automated Email Alerts
You can configure Cardtapp Analytics to send scheduled reports and custom alerts directly to your email. This means your key stakeholders stay informed even if they never log into the dashboard themselves.
Team-Level Performance Visibility
One of the most practical features for managers and team leads is the ability to view performance data across your team. Cardtapp Analytics makes it straightforward to identify top performers, flag members who may need support, and recognize patterns across the whole team.
Key Uses
Cardtapp Analytics is flexible enough to support a range of day-to-day workflows. Here are some of the most common ways teams are putting it to work.
Tracking Referral Partner Performance
Referral relationships are often the backbone of a client-driven sales business. Cardtapp Analytics helps you see which referral partners are driving installs and conversions, so you can focus on the relationships that are moving the needle.
Monitoring Campaign Effectiveness
When you launch a new marketing push, whether it’s a text campaign, a co-branded flyer, or a QR code at a live event, Cardtapp Analytics captures the downstream activity that results from it. You can connect the dots between outreach and outcomes without relying on guesswork.
Client Engagement Tracking
Understanding how and when clients are engaging with your digital business card gives you better timing for follow-ups. Cardtapp Analytics surfaces that engagement data so you can reach out when interest is highest.
Who Uses Cardtapp Analytics
Cardtapp Analytics is built for client-facing sales professionals across industries where relationships drive revenue. If your business runs on referrals, repeat clients, and consistent follow-up, this is for you.
Mortgage Professionals
Loan officers and branch managers use Cardtapp Analytics to track how many prospects are installing their digital business card, how referral partnerships are performing over time, and where conversions are happening across the pipeline. The BI analytics built into the platform are calibrated for the kind of relationship-driven sales that define the mortgage industry.
Real Estate Agents and Teams
Real estate professionals use the platform to get a clear view of how clients and partners are engaging with their content in real time. Team leads can access team and individual performance insights without needing a separate reporting tool, making it easier to coach effectively and allocate time toward the highest-value opportunities.
Insurance Professionals
Insurance agents and brokers rely on Cardtapp Analytics to measure how effectively their digital business card is driving contact and engagement, especially when managing a large book of clients across different policy lines. The automated email alerts are particularly useful for staying on top of renewal-season activity.
Sales Teams and Managers
Any sales-driven team that uses Cardtapp for client engagement and lead capture can benefit from the analytics layer. Managers get visibility into team-wide performance, and individual reps gain insight into how their own outreach is landing. The data is available in real time rather than at the end of the month.
Frequently Asked Questions
What data does Cardtapp Analytics pull from?
Cardtapp Analytics draws from the activity data generated within your Cardtapp account, giving you a consolidated view of engagement and performance across your team.
Is Cardtapp Analytics accessible on mobile?
Cardtapp’s Lead Dashboard and TappTracker are fully mobile-accessible. For the full Analytics experience with dashboards, charts, and trend views, the platform is optimized for desktop use. Automated email reports, however, are accessible on any device since they are delivered directly to your inbox.
Can I set up alerts for specific metrics rather than just scheduled reports?
Yes. The automated email system supports both scheduled reports sent on a recurring basis and custom alert notifications. This lets you stay informed about what matters most without having to monitor the dashboard continuously.
How often does the data in Cardtapp Analytics update?
Cardtapp Analytics provides real-time data updates. The trend visualizations and dashboards reflect activity as it happens within the platform, so you’re not looking at data that is days or weeks old.